

401k Case Study Using Historical Data From 1972–2007
We possibly can cut the overall costs of this plan almost in half – 46 percent. In total, company and its 401(k) participants are paying $1.2 million in costs. We can reduce that number to $644,000
Not all fees are disclosed or considered by current providers. The long-term impact of disclosed and undisclosed costs in plan participants’ accounts is significant. When you consider that existing plan costs could be reduced by up to as much as 50% this will save each employee a great deal over time.
Fee Breakdown Comparison:
Fee Impact Case Study: John Doe
How do these added fees impact the current Employee? The following case study illustrates the difference between company’s current 401(k) plan versus the proposed platform. The study helps to illustrate how the difference between these plans affects the average employee over the course of his or her career and into retirement. The study is for illustrative purposes only and does not reflect past performance or results.
John Doe began his working career, and began participating in the company 401(k) plan, in 1972. At the time, he started by rolling over his prior retirement account of $10,000. At the enrollment meeting, he decided to invest 70% into domestic stocks, and 30% into a blended bond fund. Each year, he re-balanced his portfolio to this same allocation.
Over the next 36 years, his salary grew at an average rate, and every year he contributed a total of 10% of his salary to his 401(k) account. In the end, John’s contributions over those years amounted to $109,000. The graph below shows John Doe’s asset growth over time.
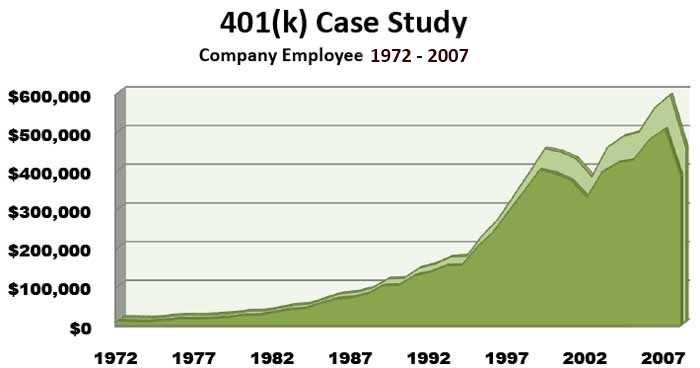
To determine his salary, we used the US Census 2nd Tier wage level, which would have been $39,000 in 2008. Assuming a plan with 1.26% in total annual fees – as company has on average with plan administrator, John’s 401(k) would have been worth $387,000 when he retired in 2008 – a pretty substantial return on his investment!
However, if we look at the alternative plan with just 0.68% in annual fees, those same contributions would have grown to $450,000 – a difference of +$62,000, or over +16%.
Take a look at how that difference in performance carries over into retirement income for Mr. Doe. Assuming that his income needs continue to rise with inflation, we can look at how well his portfolio is able to support financial needs in retirement. This case study assumes that John begins to draw on his Social Security benefits when he retires, at $15,800/year and he retires at 65 in 2008. His 401(k) provides the income left between his Social Security benefits and income needs.
As you can see in the graph below, as John begins to draw income off his $387,000 base, and the plan’s higher fees continue to drag the portfolio’s returns, the 6.5% income (hypothetical) that his portfolio produces is not enough to cover the income gap. John is then forced to draw from the base amount in his 401(k) account, based upon the higher fee account structure. Compare that to the portfolio with a better fee structure and the results are startling. As the amount of assets decrease(size of plan) the impact of loss of income increases significantly. Contact us to learn how this information could improve your company’s current expense and overall employee retirement plan.
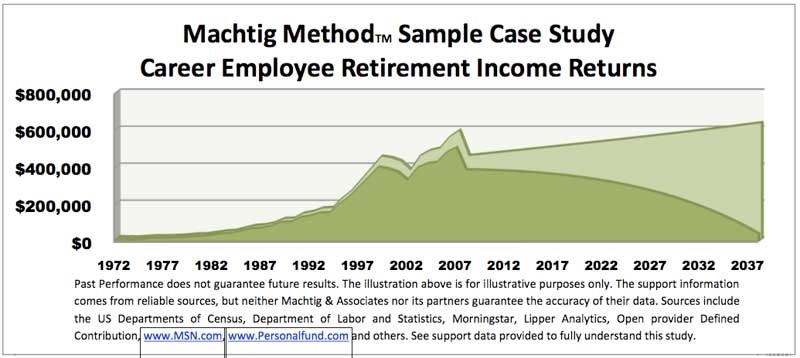
With the proposed plan’s fee structure, John is able to draw enough income from his portfolio to not need to withdraw principal. After 30 years of retirement in this case study, John would be left with $43,000 or $621,000, depending on the fee structure of his company’s 401(k) structure. This case study assumes all other factors are equal, including work tenure, wages, asset allocation, and annual contribution percentages. THE ONLY DIFFERENCE IS THE LONG-TERM IMPACT OF FEES.
All examples are hypothetical, are for illustrative purposes only and are not intended to provide tax, legal, or investment advice. Individual needs vary and require consideration of your objectives and financial situation.